ws
- fcp.ws()
Dummy function to return the white space API with help() (not used directly for plotting).
- Keyword Arguments
ws_ax_box_title (int) – White space between axes edge and box plot titles. Defaults to 10.
ws_ax_cbar (int) – White space from right axes edge to left side of cbar. Defaults to 10.
ws_ax_fig (int) – White space right edge of axes to right edge of figure [if no legend present]. Defaults to 10.
ws_ax_label_xs (int) – Extra white space between axes and label when using separate labels. Defaults to 5.
ws_ax_leg (int) – White space from right edge of axes to left edge of legend [if present]. Defaults to 5.
ws_col (int) – White space between column subplots [ignored if tick labels or axes labels are present and wider than this]. Defaults to 30.
ws_fig_ax (int) – White space from left figure edge to axes left edge. Defaults to 10.
ws_fig_label (int) – White space between top of figure and x2 label [if present]. Defaults to 10.
ws_fig_title (int) – White space from top of figure to top of title [if present]. Defaults to 10.
ws_label_col (int) – White space from axes and col labels. Defaults to ws_label_rc.
ws_label_fig (int) – White space from bottom of x label to bottom of figure. Defaults to ws_fig_label.
ws_label_rc (int) – White space between axes and row & col labels. Defaults to 10.
ws_label_row (int) – White space from axes to row labels. Defaults to ws_label_rc.
ws_label_tick (int) – White space from edge of axes label to edge of tick labels. Defaults to 10.
ws_leg_fig (int) – White space from right of legend in position 0 and figure right edge. Defaults to 10.
ws_row (int) – White space between row subplots [ignored if tick labels or axes labels are present and wider than this]. Defaults to 30.
ws_tick_minimum (int) – Minimum width for tick labels. Defaults to 10.
ws_ticks_ax (int) – White space from tick labels to edge of axes. Defaults to 5.
ws_title_ax (int) – White space bottom of title to top of axes. Defaults to 10.
Examples
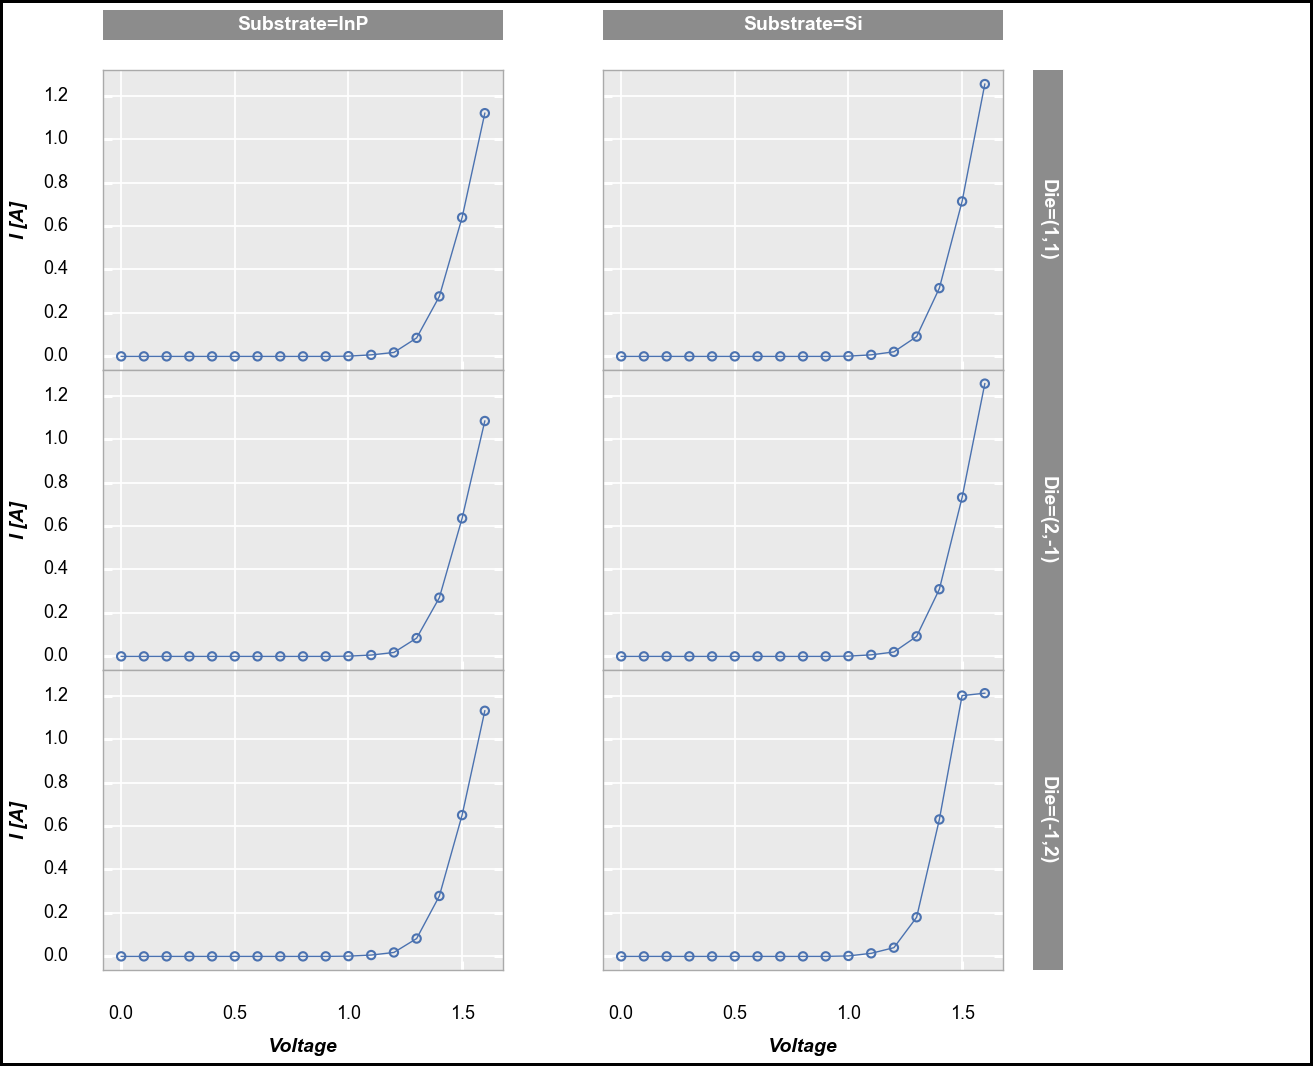
>>> import fivecentplots as fcp
>>> from pathlib import Path
>>> import pandas as pd
>>> df = pd.read_csv(Path(fcp.__file__).parent / 'test_data' / 'fake_data.csv')
>>> fcp.plot(df, x='Voltage', y='I [A]', row='Die', col='Substrate', ax_size=[400, 300],
             filter='Target Wavelength==450 & Temperature [C]==25 & Boost Level==0.2', save=True,
             fig_edge_color='#000000',
             ws_col=100, ws_row=0, ws_ax_fig=250, ws_label_rc=30, ws_ticks_ax=25, ws_label_tick=25)