markers
- fcp.markers()
Dummy function to return the markers API with help() (not used directly for plotting).
- Keyword Arguments
marker_edge_color (str|list) – Hex color string for the marker edges.
Defaults to fcp.DEFAULT_COLORS . More detailsmarker_edge_width (float) – Marker edge line width in pixels. Defaults to 1.
marker_fill (boolean) – Enable/disable color fill in markers. Defaults to False. More details
marker_fill_color (str|list) – Hex color string for the fill color of markers.
Defaults to fcp.DEFAULT_COLORS . More detailsmarker_jitter|jitter (boolean) – For boxplots add random noise on x-axis to show separation between markers. Defaults to True. More details
marker_size (float|str) – Size in pixels of the data point markers or a DataFrame column name with a custom marker size on each row. Defaults to 6. More details
markers (boolean) – Enable/disable data point markers. Defaults to True.
Examples
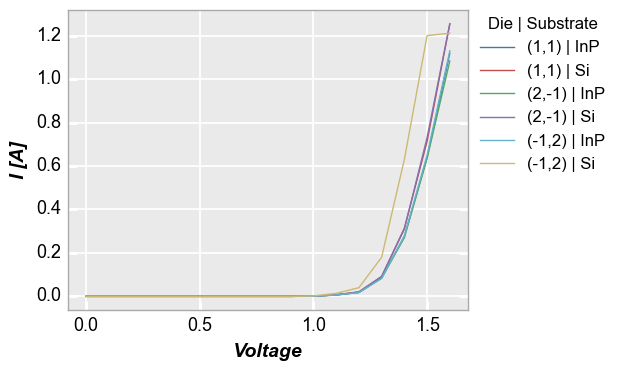
No markers:
>>> import fivecentplots as fcp
>>> from pathlib import Path
>>> import pandas as pd
>>> df = pd.read_csv(Path(fcp.__file__).parent / 'test_data' / 'fake_data.csv')
>>> fcp.plot(df, x='Voltage', y='I [A]', legend=['Die', 'Substrate'], ax_size=[400, 300],
             filter='Target Wavelength==450 & Temperature [C]==25 & Boost Level==0.2',
             markers=False)
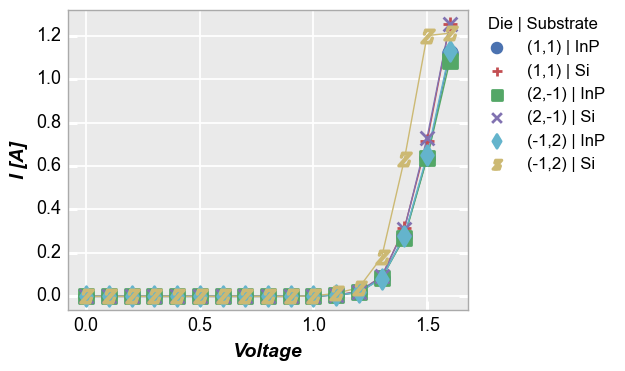
Styled markers:
>>> import fivecentplots as fcp
>>> from pathlib import Path
>>> import pandas as pd
>>> df = pd.read_csv(Path(fcp.__file__).parent / 'test_data' / 'fake_data.csv')
>>> fcp.plot(df, x='Voltage', y='I [A]', legend=['Die', 'Substrate'], ax_size=[400, 300],
             filter='Target Wavelength==450 & Temperature [C]==25 & Boost Level==0.2',
             marker_size=10, marker_edge_width=2, marker_fill=True)
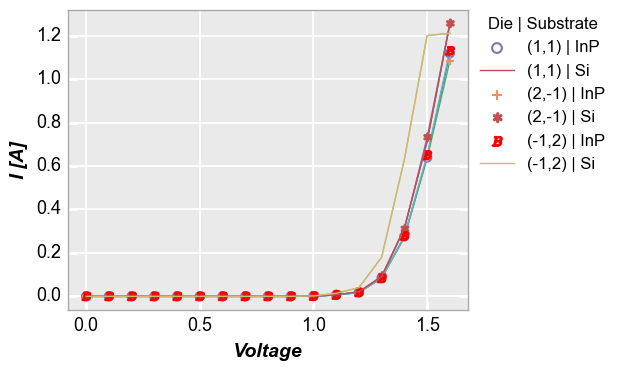
Custom markers types and color (a mix of indices from the
fcp.DEFAULT_COLORSlist and a custom hex color):>>> import fivecentplots as fcp >>> from pathlib import Path >>> import pandas as pd >>> df = pd.read_csv(Path(fcp.__file__).parent / 'test_data' / 'fake_data.csv') >>> fcp.plot(df, x='Voltage', y='I [A]', legend=['Die', 'Substrate'], ax_size=[400, 300], filter='Target Wavelength==450 & Temperature [C]==25 & Boost Level==0.2', markers=['o', None, '+', '*', 'B', None], marker_edge_color=[3, 0, 6, 1, '#FF0000'])