bar
- fcp.bar(**kwargs)
Bar chart.
- Parameters
df (pandas.DataFrame) – DataFrame containing data to plot
- Keyword Arguments
x (str) – x-axis column name [REQUIRED]
y (str) – y-axis column name [REQUIRED]
bar_align (str) – If ‘center’ aligns center of bar to x-axis value; if ‘edge’ aligns the left edge of the bar to the x-axis value. Defaults to ‘center’ .
bar_color_by_bar|color_by_bar (bool) – Color each bar differently. Defaults to False. More details
bar_edge_color (str) – Hex color string for the edge of the bar.
Defaults to fcp.DEFAULT_COLORS .bar_edge_width (float) – Width of the edge of the bar in pixels. Defaults to 0.
bar_error_bars|error_bars (bool) – Display error bars on each bar. Defaults to False. More details
bar_error_color|error_color (str) – Hex color string of the error bar lines. Defaults to #555555 .
bar_fill_alpha (float) – Transparency value for the bars between 0-1. Defaults to 0.75.
bar_fill_color (str) – Hex color string of the bar fill .
Defaults to fcp.DEFAULT_COLORS .bar_horizontal|horizontal (bool) – Display bars horizontally. Defaults to False. More details
bar_rolling|bar_rolling_mean|rolling|rolling_mean (int) – Rolling mean window size [enables this curve]. No default. More details
bar_stacked|stacked (bool) – Stack bars of a given group . Defaults to False. More details
bar_width (float) – Set the fractional width of the bars between 0-1; for stacked barplots the width corresponds to the height of the bars. Defaults to 0.8.
rolling_mean_line_color (str) – Hex color string for the rolling mean line.
Defaults to fcp.DEFAULT_COLORS . More detailsrolling_mean_line_width (int) – Width for the rolling mean line in pixels. Defaults to 2. More details
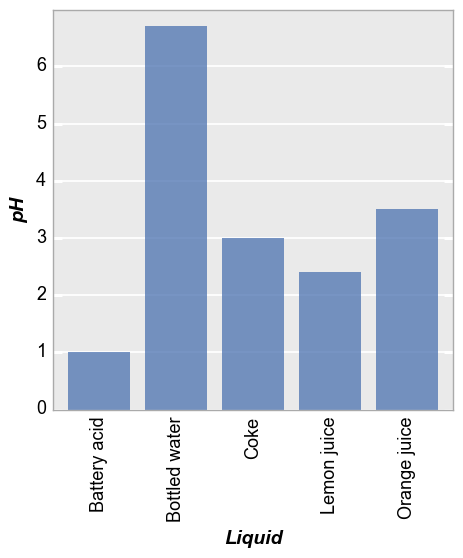
Examples
>>> import fivecentplots as fcp
>>> from pathlib import Path
>>> import pandas as pd
>>> df = pd.read_csv(Path(fcp.__file__).parent / 'test_data/fake_data_bar.csv')
>>> fcp.bar(df, x='Liquid', y='pH', filter='Measurement=="A" & T [C]==25',
            tick_labels_major_x_rotation=90)