contour
- fcp.contour(**kwargs)
Contour plot module.
- Parameters
df (DataFrame) – DataFrame containing data to plot
- Keyword Arguments
x (str) – x-axis column name [REQUIRED]
y (str) – y-axis column name [REQUIRED]
z (str) – z-axis column name [REQUIRED]
cmap (str) – Name of a color map . Defaults to inferno. More details
contour_width (float) – Width of the contour lines. Defaults to 1. More details
filled (bool) – Color area between contour lines. Defaults to True. More details
interp (str) – Scipy interpolate.griddata method to make Z points {‘linear’, ‘nearest’, ‘cubic’}. Defaults to ‘cubic’. More details
levels (int) – Number of contour lines/levels to draw. Defaults to 20. More details
show_points (bool) – Show points on top of the contour plot. Defaults to False. More details
cbar (bool) – Toggle colorbar on/off for contour and heatmap plots. Defaults to False. More details
size (int) – cbar width [height will match the height of the axes]. Defaults to 30.
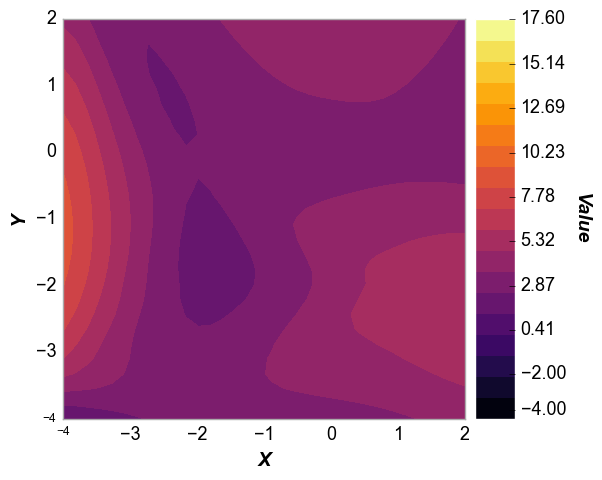
Examples
>>> import fivecentplots as fcp
>>> from pathlib import Path
>>> import pandas as pd
>>> df = pd.read_csv(Path(fcp.__file__).parent / 'test_data/fake_data_contour.csv')
>>> fcp.contour(cc, x='X', y='Y', z='Value', cbar=True, cbar_size=40, xmin=-4, xmax=2, ymin=-4, ymax=2)