legend
- fcp.legend()
Dummy function to return the legend API with help() (not used directly for plotting).
- Keyword Arguments
legend_edge_color (str) – Hex color string for the legend border. Defaults to #ffffff . More details
legend_edge_width (float) – Width of the legend border in pixels. Defaults to 1.
legend_font_size (float) – Font size of the legend text. Defaults to 12.
legend_location (int) – Position of the legend {0 = outside; 1 = upper right; 2 = upper left; 3 = lower left; 4 = lower right; 5 = right; 6 = center left; 7 = center right; 8 = lower center; 9 = upper center; 10 = center; 11 = below}. Defaults to 0. More details
legend_marker_alpha (float) – Transparency value for legend markers between 0-1. Defaults to 1. More details
legend_marker_size (float) – Marker size in the legend in pixels. Defaults to 7. More details
legend_on (boolean) – Enable/disable visibility of legend that has been created using the legend kwarg. Defaults to True [if legend enabled].
legend_points (int) – Number of points in the legend region for each entry [to enable multiple markers as in matplotlib]. Defaults to 1.
legend_title (str) – Custom title for the legend region [default is the column name used for the legend grouping].
Examples
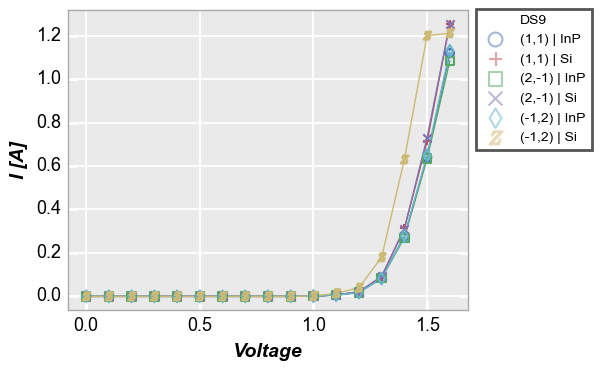
>>> import fivecentplots as fcp
>>> from pathlib import Path
>>> import pandas as pd
>>> df = pd.read_csv(Path(fcp.__file__).parent / 'test_data' / 'fake_data.csv')
>>> fcp.plot(df, x='Voltage', y='I [A]', legend=['Die', 'Substrate'],
             filter='Target Wavelength==450 & Temperature [C]==25 & Boost Level==0.2', ax_size=[400, 300],
             legend_edge_color='#555555', legend_edge_width=2, legend_font_size=10,
             legend_marker_size=10, legend_marker_alpha=0.5, legend_title='DS9')