cbar
- fcp.cbar()
Dummy function to return the colorbar API with help() (not used directly for plotting).
- Keyword Arguments
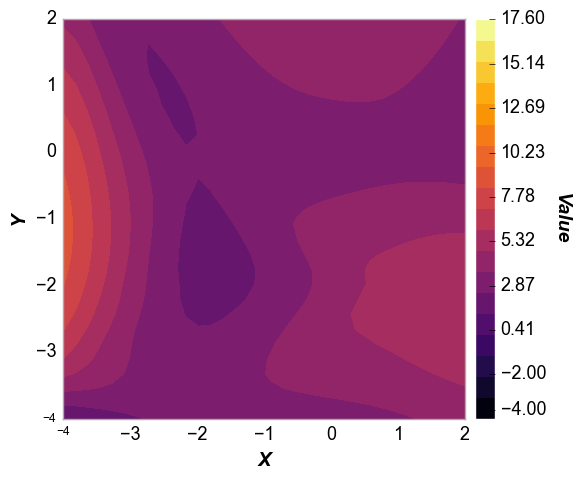
cbar (bool) – Toggle colorbar on/off for contour and heatmap plots. Defaults to False. More details
size (int) – cbar width [height will match the height of the axes]. Defaults to 30.
Examples
>>> import fivecentplots as fcp
>>> from pathlib import Path
>>> import pandas as pd
>>> df = pd.read_csv(Path(fcp.__file__).parent / 'test_data/fake_data_contour.csv')
>>> fcp.contour(cc, x='X', y='Y', z='Value', cbar=True, cbar_size=20, xmin=-4, xmax=2, ymin=-4, ymax=2)