axes
- fcp.axes()
Dummy function to return the axes API with
help()(not used directly for plotting).- Keyword Arguments
ax_edge_alpha (str) – Transparency value for axes edge between 0-1. Defaults to 1.
ax_edge_bottom (boolean) – Enable/disable the bottom axes edge (or spine). Defaults to True. More details
ax_edge_color (str) – Hex color string for the border edge of the axes region. Defaults to #aaaaaa . More details
ax_edge_left (boolean) – Enable/disable the left axes edge (or spine). Defaults to True. More details
ax_edge_right (boolean) – Enable/disable the right axes edge (or spine). Defaults to True. More details
ax_edge_top (boolean) – Enable/disable the top axes edge (or spine). Defaults to True. More details
ax_edge_width (float) – Width of the axes border in pixels. Defaults to 1.
ax_fill_alpha (str) – Transparency value for axes fill between 0-1. Defaults to 1. More details
ax_fill_color (str) – Hex color string for the fill color of the axes region. Defaults to #eaeaea . More details
ax_scale|ax2_scale (str) – Set the scale type of the axes {‘linear’; ‘logx’; ‘semilogx’; ‘logy’; ‘semilogy’; ‘loglog’; ‘log’; ‘symlog’; ‘logit’}. Defaults to ‘linear’. More details
ax_size (list of int | str) – Axes size [width, height]; note this is not the size of the entire figure but just the axes area; for boxplots can enter ‘auto’ to auto-scale the width. Defaults to [400, 400]. More details
share_col (boolean) – Share the x and y axis ranges of subplots in the same column when grouping. Defaults to True. More details
share_row (boolean) – Share the x and y axis ranges of subplots in the same row when grouping. Defaults to True. More details
share_x (boolean) – Share the x-axis range across grouped plots with multiple axes. Defaults to True. More details
share_x2 (boolean) – Share the secondary x-axis range across grouped plots with multiple axes. Defaults to True. More details
share_y (boolean) – Share the y-axis range across grouped plots with multiple axes. Defaults to True. More details
share_y2 (boolean) – Share the secondary y-axis range across grouped plots with multiple axes. Defaults to True. More details
twin_x (boolean) – Add a secondary y-axis by “twinning” the x-axis. Defaults to False. More details)
twin_y (boolean) – Add a secondary x-axis by “twinning” the y-axis. Defaults to False. More details)
Examples
>>> import fivecentplots as fcp
>>> from pathlib import Path
>>> import pandas as pd
>>> df = pd.read_csv(Path(fcp.__file__).parent / 'test_data' / 'fake_data.csv')
>>> fcp.plot(df, x='Voltage', y=['Voltage', 'I [A]'], legend=['Die', 'Substrate'],
             col='Boost Level', twin_x=True,
             share_y=False, share_y2=False, share_x=True,
             filter='Target Wavelength==450 & Temperature [C]==25',
             ax_edge_color='#FF0000', ax_edge_left=False, ax_edge_right=False, ax_edge_width=2,
             ax_fill_color='#96BEAA', ax_fill_alpha=0.5,
             ax_scale='logx', ax_size=[400, 300])
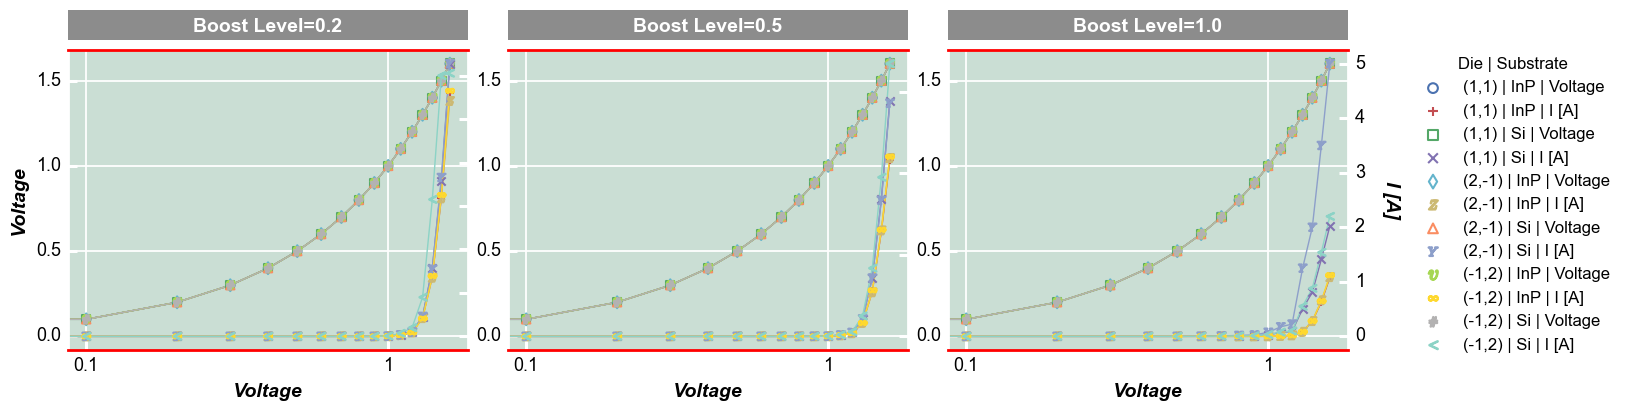
Axes element is shown in olive green with red borders