figure
- fcp.figure()
Dummy function to return the figure API with help() (not used directly for plotting).
- Keyword Arguments
dpi (int) – Dots per square inch resolution for the figure. Defaults to 100.
fig_edge_alpha (str) – Transparency value for figure edge between 0-1. Defaults to 1.
fig_edge_color (str) – Hex color string for the border edge of the figure region. Defaults to #aaaaaa . More details
fig_edge_width (float) – Width of the figure border in pixels. Defaults to 3.
fig_fill_alpha (str) – Transparency value for figure fill between 0-1. Defaults to 1. More details
fig_fill_color (str) – Hex color string for the fill color of the figure region. Defaults to #eaeaea . More details
Examples
>>> import fivecentplots as fcp
>>> from pathlib import Path
>>> import pandas as pd
>>> df = pd.read_csv(Path(fcp.__file__).parent / 'test_data' / 'fake_data.csv')
>>> fcp.plot(df, x='Voltage', y='I [A]', legend=['Die', 'Substrate'],
             filter='Target Wavelength==450 & Temperature [C]==25 & Boost Level==0.2',
             fig_edge_color='#000000', fig_edge_width=3, fig_edge_alpha=0.5,
             fig_fill_color='#96BEAA', fig_fill_alpha=0.8,
             ax_size=[400, 300]
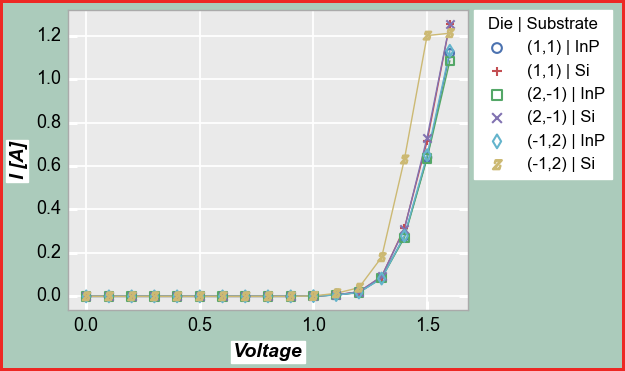
Figure element is shown in olive green with red border