plot
- fcp.plot(**kwargs)
XY plot.
- Parameters
df (DataFrame) – DataFrame containing data to plot
- Keyword Arguments
x (str | list) – x-axis column name(s) [REQUIRED]
y (str | list) – y-axis column name(s) [REQUIRED]
cmap (str) – Color map name (overrides all other color parameters). Defaults to None. More details
line_alpha (str|list) – Transparency value for the line(s) between 0-1. Defaults to 1. More details
line_color (str|list) – Hex color string or list of hex color strings for the plot lines. Defaults to fcp.DEFAULT_COLORS. More details
line_style (str|list) – Matplotlib string character for line style {‘-‘; ‘–’; ‘-.’ ‘:’}. Defaults to ‘-‘. More details
line_width (int|list) – Line width in pixels. Defaults to 1. More details
lines (boolean) – Enable/disable plotting of lines. Defaults to True. More details
marker_edge_color (str|list) – Hex color string for the marker edges.
Defaults to fcp.DEFAULT_COLORS . More detailsmarker_edge_width (float) – Marker edge line width in pixels. Defaults to 1.
marker_fill (boolean) – Enable/disable color fill in markers. Defaults to False. More details
marker_fill_color (str|list) – Hex color string for the fill color of markers.
Defaults to fcp.DEFAULT_COLORS . More detailsmarker_jitter|jitter (boolean) – For boxplots add random noise on x-axis to show separation between markers. Defaults to True. More details
marker_size (float) – Size in pixels of the data point markers. Defaults to 6.
markers (boolean) – Enable/disable data point markers. Defaults to True.
ax_hlines|ax2_hlines (float|list of tuples and floats) – Add horizontal lines to the plot; if only float value is provided add a solid black line with width=1 pixel at that value; if tuple add any one or more of the following in order: [1] float value or DataFrame column name [required]; [2] hex string for line color; [3] line style str; [4] line width in pixels; [5] line alpha transparency value from 0-1; [6] legend text [added automatically if using a column name for value]. Defaults to None. More details
ax_vlines|ax2_vlines (float|list of tuples and floats) – Add vertical lines to the plot [same parameters as ax_hlines]. Defaults to None. More details
ax_[h|v]lines (list of values) – Add a line with a different value to each subplot when using row/col/wrap grouping. Defaults to None. More details
control_limit_side (str) – Determines if shaded region is <= lcl and >= ucl {“outside”} or between the lcl and ucl {“inside”}. Defaults to outside. More details
lcl (float) – Float value to start the lower control limit shading region. Defaults to None. More details
lcl|ucl_edge_alpha (float) – Transparency value for the line starting the control limit shaded region between 0-1. Defaults to 0.25.
lcl|ucl_edge_color (str) – Hex color string for the the line starting the control limit shaded region. Defaults to fcp.DEFAULT_COLORS.
lcl|ucl_edge_style (str) – Line style for the line starting the control limit shaded region {‘-’, ‘–’, ‘-.’, ‘:’}. Defaults to ‘-‘.
lcl|ucl_edge_width (float) – Width of the line starting the control limit shaded region in pixels. Defaults to 1.
lcl|ucl_fill_alpha (float) – Transparency value for the control limit shaded region fill between 0-1. Defaults to 0.20. More details
lcl|ucl_fill_color (str) – Hex color string for the control limit shaded region fill. Defaults to fcp.DEFAULT_COLORS. More details
ucl (float) – Float value to start the upper control limit shading region. Defaults to None. More details
conf_int (float) – Interval with upper and lower bounds based on a single confidence value between 0-1 (typical=0.95). Defaults to None. More details
conf_int_|perc_int_|nq_int_edge_alpha (float) – Transparency value for the lines bounding the interval shaded region between 0-1. Defaults to 0.25. More details
conf_int_|perc_int_|nq_int_edge_color (str) – Hex color string for the the lines bounding the interval shaded region.
Defaults to fcp.DEFAULT_COLORS . More detailsconf_int_|perc_int_|nq_int_edge_style (str) – Line style for the lines bounding the interval shaded region {‘-’, ‘–’, ‘-.’, ‘:’}. Defaults to ‘-‘. More details
conf_int_|perc_int_|nq_int_edge_width (float) – Width of the lines bounding the interval shaded region in pixels. Defaults to 1. More details
conf_int_|perc_int_|nq_int_fill_alpha (float) – Transparency value for the interval shaded region fill between 0-1. Defaults to 0.20. More details
conf_int_|perc_int_|nq_int_fill_color (str) – Hex color string for the interval shaded region fill. Defaults to fcp.DEFAULT_COLORS. More details- interval
nq_int (list of float) – Interval with upper and lower bounds based on values of sigma (where the mean of a distribution is sigma=0). Defaults to None. More details
perc_int (list of float) – Interval with upper and lower bounds based on percentiles between 0-1. Defaults to None. More details
fit (int) – Polynomial degree for the fit. Defaults to None. More details
fit_color (str) – Hex color string for the fit line. Defaults to #000000 .
fit_eqn (boolean) – Display the fit equation on the plot. Defaults to False.
fit_font_size (float) – Font size of the fit eqn and rsq value. Defaults to 12.
fit_padding (int) – Padding in pixels from the top of the plot to the location of the fit eqn. Defaults to 10.
fit_range_x (list) – Compute the fit only over a given range of x-values. Defaults to None. More details
fit_range_y (list) – Compute the fit only over a given range of y-values. Defaults to None.
fit_rsq (boolean) – Display the rsq of the fit on the plot. Defaults to False.
ref_line (list|pd.Series) – The name of one or more columns in the DataFrame or a pandas Series with the same number of rows as the x column. Defaults to None. More details
ref_line_alpha (str|list) – Transparency value for the reference line(s) between 0-1 (use list if more than one ref_line plotted). Defaults to 1. More details
ref_line_color (str|list) – Hex color string or list of hex color strings for the reference line (use list if more than one ref_line plotted). Defaults to #000000 . More details
ref_line_legend_text (str|list) – Custom string label(s) to add to a legend for the reference line data (use list if more than one ref_line plotted). Defaults to None. More details
ref_line_style (str|list) – Matplotlib string character for reference line style {‘-‘; ‘–’; ‘-.’ ‘:’} (use list if more than one ref_line plotted). Defaults to ‘-‘. More details
ref_line_width (int|list) – Reference line width in pixels (use list if more than one ref_line plotted). Defaults to 1. More details
stat (str) – Calculate a statistic on a data set (any stat value supported by pandas.groupby is valid {‘mean’, ‘std’, etc}. Defaults to None. More details- lines
stat_line_xxx (various) – Stat-line styling is controlled by the regular line_xxx values. Defaults to None.
stat_val (str) – Alternate column name used as a pseudo x-axis for the stat calculation for cases in which the plotted x-column values are not perfectly aligned. Defaults to None. More details
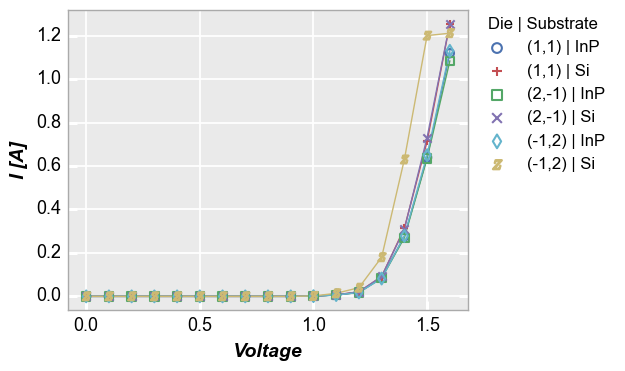
Examples
>>> import fivecentplots as fcp
>>> from pathlib import Path
>>> import pandas as pd
>>> df = pd.read_csv(Path(fcp.__file__).parent / 'test_data' / 'fake_data.csv')
>>> fcp.plot(df, x='Voltage', y='I [A]', legend=['Die', 'Substrate'], ax_size=[400, 300],
             filter='Target Wavelength==450 & Temperature [C]==25 & Boost Level==0.2')