grouping
- fcp.grouping()
Dummy function to return the grouping API with help() (not used directly for plotting).
- Keyword Arguments
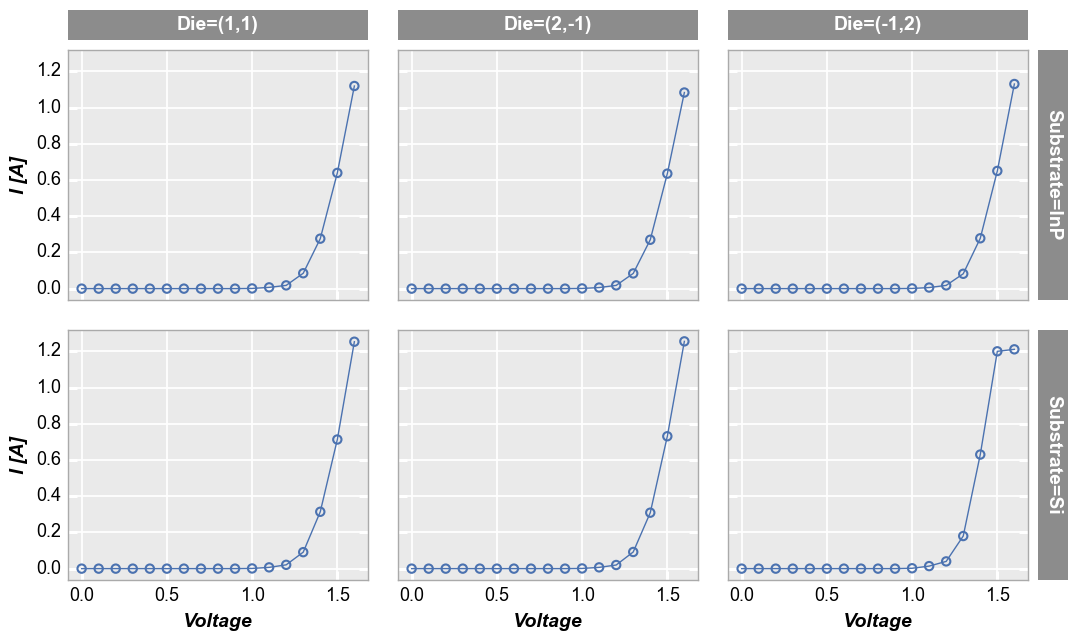
col (str) – [1] name of DataFrame column for grouping into columns of subplots based on each unique value; or [2] col=”x” with multiple values defined for “x” creates columns of subplots for each x-value. Defaults to None.
groups (str|list) – for xy plot = name of DataFrame column that can be used to separate the data into unique groups so plot lines do not circle back on themselves. Defaults to None. More details
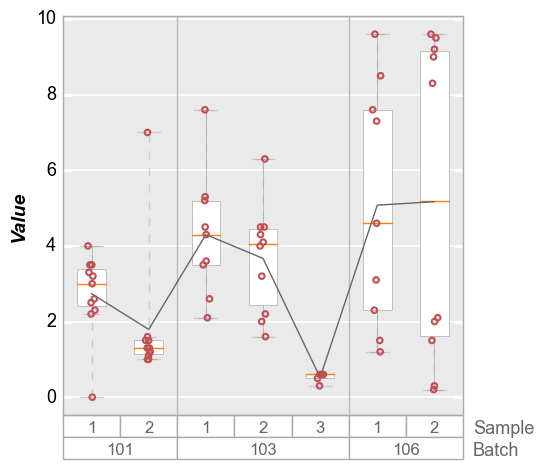
groups – for boxplot = name or list of names of DataFrame column(s) used to split the data into separate boxes. Defaults to None. More details
row (str) – [1] name of DataFrame column for grouping into rows of subplots based on each unique value; or [2] row=”y” with multiple values defined for “y” creates rows of subplots for each y-value. Defaults to None.
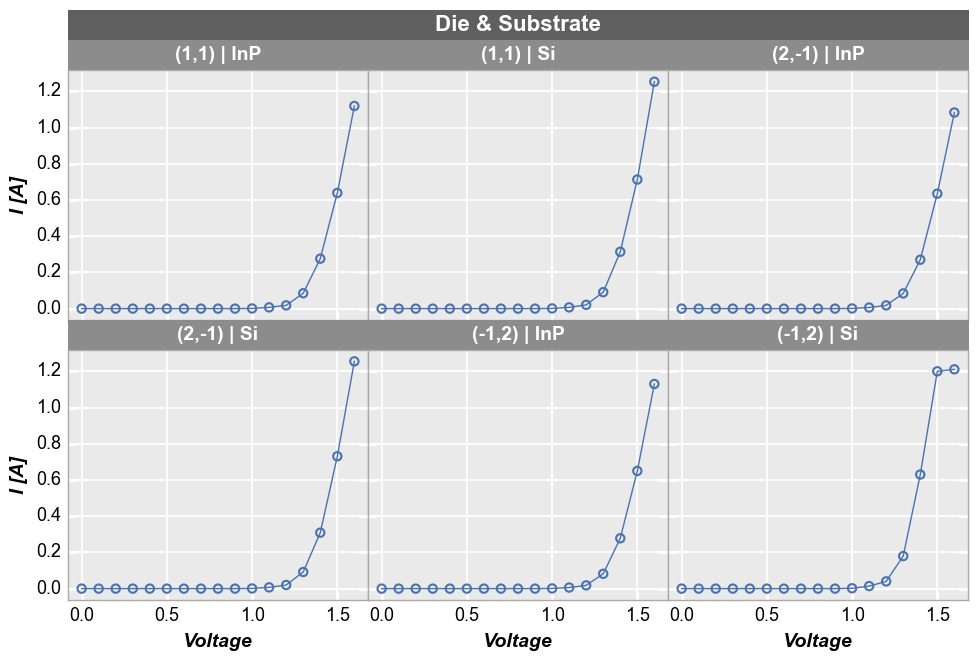
wrap (str|list) – [1] name or list of names of DataFrame column(s) for grouping into a grid of subplots; [2] wrap=”x” with multiple values defined for “x” creates a grid of subplots for each x-value; or [3] wrap=”y” with multiple values defined for “y” creates a grid of subplots for each y-value. Defaults to None.
Examples
Row by column style:
>>> import fivecentplots as fcp
>>> from pathlib import Path
>>> import pandas as pd
>>> df = pd.read_csv(Path(fcp.__file__).parent / 'test_data' / 'fake_data.csv')
>>> fcp.plot(df, x='Voltage', y='I [A]', col='Die', row='Substrate',
             filter='Target Wavelength==450 & Temperature [C]==25 & Boost  Level==0.2', ax_size=[300, 250])
Wrap style:
>>> import fivecentplots as fcp
>>> from pathlib import Path
>>> import pandas as pd
>>> df = pd.read_csv(Path(fcp.__file__).parent / 'test_data' / 'fake_data.csv')
>>> fcp.plot(df, x='Voltage', y='I [A]', wrap=['Die', 'Substrate'],
             filter='Target Wavelength==450 & Temperature [C]==25 & Boost  Level==0.2', ax_size=[300, 250])
Box plot:
>>> import fivecentplots as fcp
>>> from pathlib import Path
>>> import pandas as pd
>>> df = pd.read_csv(Path(fcp.__file__).parent / 'test_data' / 'fake_data.csv')
>>> fcp.plot(df, y='Value', groups=['Batch', 'Sample'])