heatmap
- fcp.heatmap(**kwargs)
Heatmap plot.
- Parameters
df (DataFrame) – DataFrame containing data to plot
- Keyword Arguments
x (str) – x-axis column name [REQUIRED]
y (str) – y-axis column name [REQUIRED]
z (str) – z-axis column name [REQUIRED]
cell_size (int) – Width of a heatmap cell in pixels. Defaults to 60. More details
cmap (bool) – Name of a color map to apply to the plot. Defaults to inferno. More details
data_labels (bool) – Toggle visibility of value text labels on the heatmap cells. Defaults to False. More details
heatmap_edge_width (float) – Width of the edges of the heat map cells. Defaults to 0.
heatmap_font_color (str) – Hex color string for the value label text. Defaults to #ffffff .
heatmap_font_size (int) – Font size of the value label text. Defaults to 12.
heatmap_interp|interp (str) – imshow interpolation scheme [see matplotlib docs for more details]. Defaults to ‘none’.
cbar (bool) – Toggle colorbar on/off for contour and heatmap plots. Defaults to False. More details
size (int) – cbar width [height will match the height of the axes]. Defaults to 30.
Examples
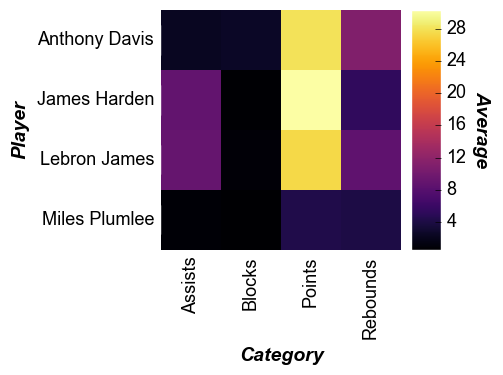
Categorical heatmap:
>>> import fivecentplots as fcp
>>> from pathlib import Path
>>> import pandas as pd
>>> df = pd.read_csv(Path(fcp.__file__).parent / 'test_data/fake_data_heatmap.csv')
>>> fcp.heatmap(df, x='Category', y='Player', z='Average')
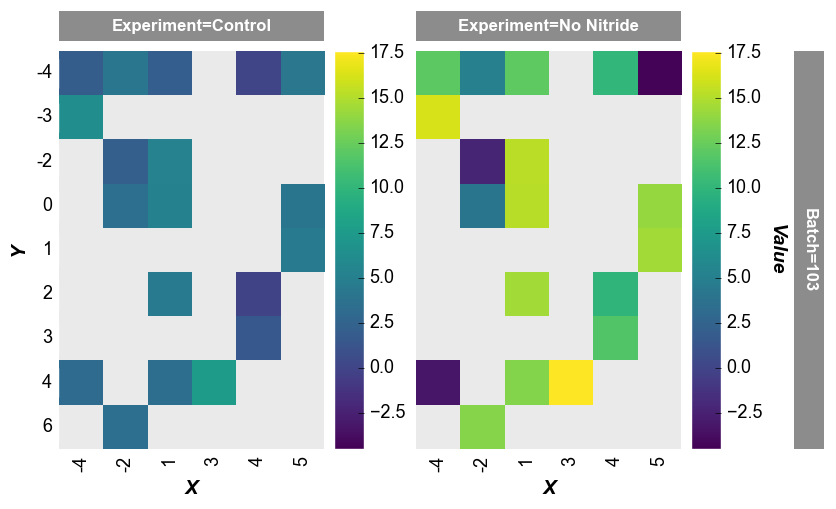
Non-uniform numerical data:
>>> import fivecentplots as fcp
>>> from pathlib import Path
>>> import pandas as pd
>>> df = pd.read_csv(Path(fcp.__file__).parent / 'test_data/fake_data_contour.csv')
>>> fcp.heatmap(df, x='X', y='Y', z='Value', row='Batch', col='Experiment',
                cbar=True, share_z=True, ax_size=[400, 400], data_labels=False,
                label_rc_font_size=12, filter='Batch==103', cmap='viridis')