Keyword Arguments
Mandatory
All inputs to fivecentplots are treated as keyword arguments. The function call (plot, boxplot, hist, etc.)
determines the kind of plot, but keywords determine what data is included and how the plot is styled and arranged.
Most keywords are completely optional or can be loaded automatically from a user theme file. The
only mandatory inputs to plot functions involve the basics of the data that should be plotted:
Keyword |
Data Type |
Description |
Required? |
|---|---|---|---|
df |
pandas DataFrame |
DataFrame containing all data to be plotted including grouping columns |
always (note: |
x |
str |
Column name of the x-axis data |
all except boxplot |
y |
str |
Column name of the y-axis data |
all except histogram |
z |
str |
Column name of the z-axis data |
only for contour and heatmap |
Elements
Each item in a plot layout (axis, labels, legend, etc.) is represented by an
Element object that contains important attributes like edge color, fill color,
size, font, etc., that fully describe the element. All the
base attributes of a particular Element can be overriden by keywords provided
either in a user theme file or at the time of the plot function call.
Nomenclature
Keywords that access the attributes of an element mostly follow a specific formula:
Keyword Naming Scheme
<element name>_<major|minor axis type (if any)>_<x|y|z axis (if any)>_<element attribute name>
Consider the following examples:
Change the x label font color to red:
label_x_font_color = ‘#FF0000’
Change the y-axis minor gridline width:
grid_major_y_width = 2
Change the axes edge color to black:
ax_edge_color = ‘#000000’
Change the whisker color in a box plot:
box_whisker_color = #FF00FF
Some elements have attributes that fall outside of the scope of the Default Attributes. These still follow the general nomenclature found above. For example:
Display the fit equation and rsq value of a line fit:
fit_eqn = True fit_rsq = True
Set a different marker size just for the legend
legend_marker_size = 8
Change the statistic of the connecting line on a boxplot:
box_stat_line = ‘std’
There are also a handful of keywords that allow a shorthand notation when
defining them in the function call. For example, if you are calling boxplot
and want to convert the box to a violin, you can use either box_violin=True
or violin=True. However, the long form of such values is still required in
theme files.
Listed below are the keyword arguments of specific elements. Note that some keywords deviate from the standard nomenclature given what they represent.
Note
We only list the base Element attributes below which have a
default value different than what is specified in the table
above for base attributes. Base attributes that
do not apply to a given Element are also listed.
Base attributes
Each Element object contains a basic set of attributes which may or may not be used
depending on the specifics of the element:
Category |
Keyword |
Description |
Default |
Example |
|---|---|---|---|---|
Fill |
fill_alpha |
fill color opacity [0 (fully transparent) - 1 (opaque)] |
1 |
|
fill_color |
fill color (hex color code) |
#ffffff |
||
Edges |
edge_alpha |
edge color opacity [0 (fully transparent) - 1 (opaque)] |
1 |
|
edge_width |
width in pixels of the element border |
1 |
||
edge_color |
edge color (hex color code) |
#ffffff |
||
Fonts |
font |
font name for element text |
sans-serif |
|
font_color |
font color (hex color code) |
#000000 |
||
font_size |
font size in pixels |
14 |
||
font_style |
font style [‘normal’, ‘italic’, ‘oblique’] |
normal |
||
font_weight |
font weight [‘light’, ‘normal’, ‘medium’, ‘semibold’, ‘bold’, ‘heavy’, ‘black’] |
normal |
||
Lines |
alpha |
line opacity |
1 |
|
color |
line color (hex color code) |
#000000 |
||
style |
line style [‘-‘, ‘–’, ‘-.’, ‘:’] |
|||
width |
line width in pixels |
1 |
||
Other |
on |
toggle visibility of the element |
depends |
|
size |
[width, height] of the object |
|||
text |
label text associated with the object |
Axes
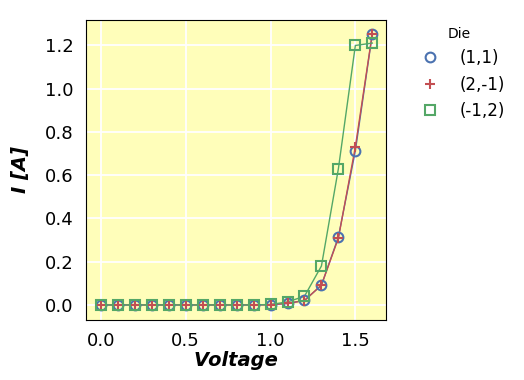
The axes element consists of the actual plotting window shown in yellow above.
Keywords for the primary axes object begin with the prefix “ax_”. Properties
of any optional secondary axes begin with the prefix “ax2_”.
Keyword |
Data Type |
Description |
Default |
Example |
|---|---|---|---|---|
ax_edge_color |
hex color string |
outer edge color of plot area |
#aaaaaa |
None |
ax_fill_color |
hex color string |
inner fill color of plot area |
#eaeaea |
None |
ax_scale |
str |
enable linear vs log scaling of axis |
||
x-axis: [‘linear’, ‘logx’, ‘semilogx’] |
||||
y-axis: [‘linear’, ‘logx’, ‘semilogx’] |
||||
both: [‘loglog’, ‘log’] |
||||
other: [‘symlog’, ‘logit’] |
||||
ax_size |
list of ints |
width, height of plot area |
[400, 400] |
None |
spines |
boolean |
show all axis edges |
True |
|
spine_bottom |
boolean |
show bottom axis edge |
True |
|
spine_left |
boolean |
show left axis edge |
True |
|
spine_right |
boolean |
show right axis edge |
True |
|
spine_top |
boolean |
show top axis edge |
True |
|
twin_x |
boolean |
enable/disable a secondary y-axis (x-axis is “twinned” or duplicated across two y-axes) |
False |
|
twin_y |
boolean |
enable/disable a secondary x-axis (y-axis is “twinned” or duplicated across two x-axes) |
False |
|
Note: wrap plots cannot be used when |
||||
xmin |
float|list of floats|None |
minimum x-values; can use a list for each subplot |
None |
|
x2min |
float|list of floats|None |
minimum x-values; can use a list for each subplot |
None |
|
xmax |
float|list of floats|None |
maximum x-values; can use a list for each subplot |
None |
|
x2max |
float|list of floats|None |
maximum x-values for secondary axis; can use a list for each subplot |
None |
|
ymin |
float|list of floats|None |
minimum y-values; can use a list for each subplot |
None |
|
y2min |
float|list of floats|None |
minimum y-values for secondary axis; can use a list for each subplot |
None |
|
ymax |
float|list of floats|None |
maximum y-values; can use a list for each subplot |
None |
|
y2max |
float|list of floats|None |
maximum y-values for secondary axis; can use a list for each subplot |
None |
The following base attributes of the Element class are not used for this item:
“Fonts” category
“Lines” category
text
Boxplots
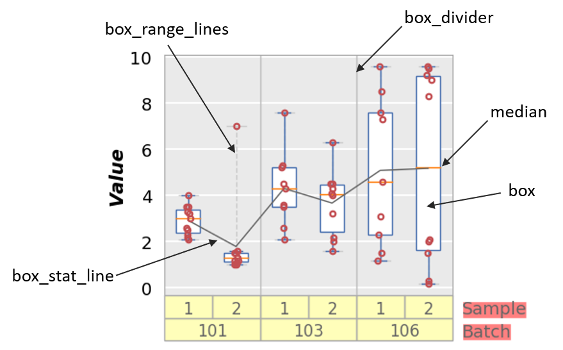
Boxplots have several unique Element objects that can be styled:
Boxes: the actual boxes of the box plot (shown in white with a blue border above) are accessed using keywords with the prefix
box_:
Keyword
Data Type
Description
Default
Example
box_on
boolean
toggle box visibility
True
box_edge_color
str
edge color of the boxes
#4b72b0
box_fill_color
str
fill color of the boxes
#ffffff
box_median_color
str
color of the median line within the boxes
#ff7f0e
notch
boolean
use a notched-style box instead of a rectangular box
False
Divider lines: optional vertical divider lines between groups
These lines are styled using keywords with the prefix
box_dividerand use the “Lines” category of base attributes for theElementobject. They are enabled by default but can be turned off withbox_divider=False:
Keyword
Data Type
Description
Default
box_divider_on
boolean
toggle divider lines between groups on/off
True
box_divider_color
str
line color
#bbbbbb
Group labels: labels directly under each box that indicate the unique group values of the given box (shown in yellow above).
Keyword Prefix
box_group_label_
These labels are styled using keywords with the prefix
box_group_label_and are similar to other label elements.
Group titles: labels to the right of the group labels that indicate the DataFrame column name of each grouping column (shown in salmon above).
These labels are controlled using keywords with the prefix
box_group_title_and are similar to other label elements.
Range lines: optional lines within a single box that span the entire range of the data set. These are useful for visualization of outlier points that may be outside of the selected ymin/ymax range. They are accessed using keywords with the prefix
box_range_lines_:
Keyword
Data Type
Description
Default
box_range_lines_on
boolean
toggle range lines on/off
True
box_range_lines_color
str
line color
#cccccc
box_range_lines_style
str
horizontal lines at the end of the range
box_range_lines_style2
str
vertical lines connecting the horizontal lines at the end of the range
–
Stat lines: optional connecting line between each box at some statistical value calculated from the data for a single box. Options include any stat that can be computed via the
groupbycommand on a pandas DataFrame (i.e., “mean”, “median”, “std”, etc.). Box stat lines are accessed using keywords with the prefixbox_stat_line_:
Keyword
Data Type
Description
Default
box_stat_line_on
boolean
toggle divider lines between groups on/off
True
box_stat_line
str
set the statistic for the connecting line
mean
box_stat_line_color
str
line color
#666666
Color Bar
A color bar (or “cbar”) is a colorized gradient scale used to signify the z-value of data plotted in an X-Y plane on a contour or heatmap plot. By default, the color bar is disabled.
Keyword |
Data Type |
Description |
Default |
Example |
|---|---|---|---|---|
cbar |
boolean |
toggle colorbar on/off for contour and heatmap plots |
False |
|
size |
int |
cbar width (height will match the height of the axes) |
30 |
The color bar text label is pulled from the column name supplied for the keyword
z, but can be overriden via the keyword label_z. All font keywords which
belong to the base Element class can be used to style the color bar text.
The following base attributes of the Element class are not used for this item:
“Lines” category
text
Contour
Contour plots have a few options that can be specified via keyword:
Keyword |
Data Type |
Description |
Default |
Example |
|---|---|---|---|---|
cmap |
str |
Name of a color map |
inferno |
|
filled |
boolean |
Fill area between contour lines |
True |
|
levels |
int |
Number of contour lines/levels to draw |
20 |
Figure
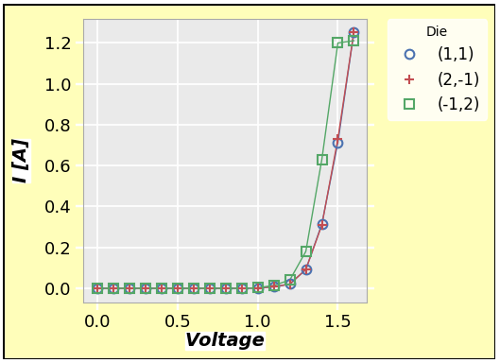
Note
To style the figure region in yellow for this example, the following keywords were
used in the fcp.plot command:
fig_edge_color='#000000', fig_fill_color='#fffd75', fig_fill_alpha=0.5
Notice, we are just accessing default Element class attributes and prepending
the keywords with the element name, fig_ in this case.
The figure element is the full window in which other elements are rendered.
Most of the figure region is covered by these other elements but the visible
portion (shown in yellow above) can be styled. figure elements can also
be subdivided into multiple subplots to display more data. Unlike matplotlib, the
size of the figure window is caluculated automatically by the sizes of the discrete
elements it contains. It cannot be set directly.
Keyword Prefix
fig_
Keyword |
Data Type |
Description |
Default |
|---|---|---|---|
dpi |
int |
dots per inch |
100 |
The following base attributes of the Element class are not used for this item:
“Fonts” category
“Lines” category
on
size
text
Fit
fivecentplots can add a polynomial fit to a data set. This is controlled via
the family of keywords beginning with fit_:
Keyword |
Data Type |
Description |
Default |
Example |
|---|---|---|---|---|
fit |
int |
polynomial degree for the fit |
None |
|
fit_color |
hex color str |
color of the fit line |
#000000 |
None |
fit_eqn |
boolean |
display the fit equation on the plot |
False |
None |
fit_font_size |
float |
font size of the fit eqn and rsq value |
12 |
None |
fit_padding |
int |
padding in pixels from the top of the plot to the location of the fit eqn |
10 |
None |
fit_range_x |
list |
compute the fit only over a given range of x-values |
None |
|
fit_range_y |
list |
compute the fit only over a given range of y-values |
None |
|
fit_rsq |
boolean |
display the rsq of the fit on the plot |
False |
None |
The following base attributes of the Element class are not used for this item:
“Fill” category
“Edges” category
“Fonts” category
on
size
text
Gridlines
A plot can have both major and minor grids on both primary and secondary axes. Only major grids are enabled by default.
Grids properities are accessed by keywords with the following nomenclature:
Keyword Naming Scheme
<grid>_<major|minor>_<x|y|z|blank>_<element attribute name>
To specify grids of a specific axis you must include the axis designation in the keyword. If the axis is not specified, the property will be applied to all axes.
Keyword |
Data Type |
Description |
Default |
Example |
|---|---|---|---|---|
grid_major |
boolean |
Toggle major grid visibility for primary x and y axes |
True |
` Major grid enabled/disabled <ticks.html#Major-grid>`_ |
grid_major_x |
boolean |
Toggle major grid visibility for primary x axis |
True |
None |
grid_major_x2 |
boolean |
Toggle major grid visibility for secondary x axis |
False |
None |
grid_major_y |
boolean |
Toggle major grid visibility for primary y axis |
True |
None |
grid_major_y2 |
boolean |
Toggle major grid visibility for secondary y axis |
False |
None |
grid_minor |
boolean |
Toggle minor grid visibility for primary x and y axes |
False |
` Minor grid enabled/disabled <ticks.html#Minor-grid>`_ |
grid_minor_x |
boolean |
Toggle minor grid visibility for primary x axis |
False |
None |
grid_minor_x2 |
boolean |
Toggle minor grid visibility for secondary x axis |
False |
None |
grid_minor_y |
boolean |
Toggle minor grid visibility for primary y axis |
False |
None |
grid_minor_y2 |
boolean |
Toggle minor grid visibility for secondary y axis |
False |
None |
grid_major|minor_x|y|blank_color |
str |
Grid line color |
#ffffff |
None |
grid_major|minor_x|y|blank_style |
str |
Grid line style (follows matplotlib standards: ‘-‘, ‘–’, etc) |
None |
|
grid_major|minor_x|y|blank_width |
float |
Grid line width |
1.3 |
None |
Heatmap
Heatmaps are a useful way to display categorical data or colorized images. The following keywords are available for this platform:
Keyword |
Data Type |
Description |
Default |
Example |
|---|---|---|---|---|
cell_size |
int |
width of a heatmap cell |
60 |
|
cmap |
boolean |
toggle colorbar on/off for contour and heatmap plots |
False |
|
data_labels |
boolean |
enable/disable value labels on the heatmap cells |
False |
|
heatmap_font_xxx |
various |
data label fonts are controlled by standard font attributes with the prefix “heatmap” |
Various |
None |
Labels
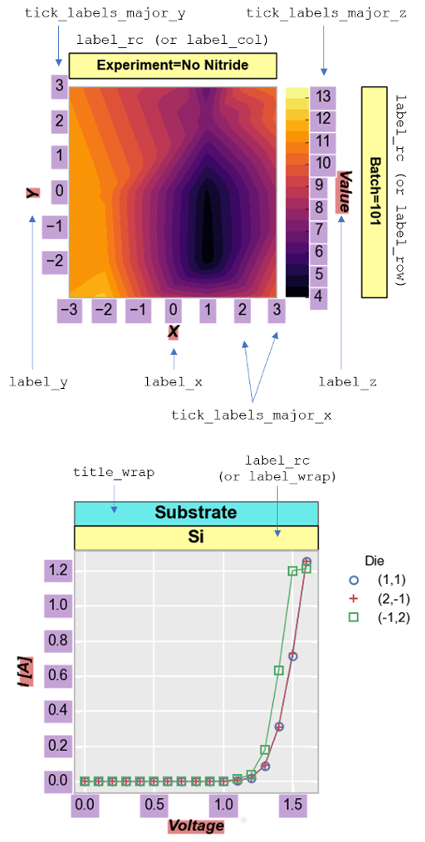
The following types of label elements can exist in a plot:
axis labels (colored in salmon on right)
Keyword Prefix
- Single axis:
label_x_
label_y_
label_z_ (aka colorbar title)
- All axes together:
label_
The default text for axes labels is pulled from the corresponding DataFrame column names used to define these values (i.e., the
label_xtext will match the value ofx). However, axes label text can be overriden by setting a value for the label such aslabel_x='New Name'.row, column, and wrap labels (colored in yellow on right)
Keyword Prefix
- Single grouping type:
label_row_
label_col_
label_wrap_
- All row/column labels together:
rc_label_
The text for row and column labels is the DataFrame column name followed by the unique value corresponding to that row or column of plots. The text for wrap labels will be a tuple of the unique values of the DataFrame columns specified for the
wrapkeyword. Unlike axes label text, row, column, or wrap label text cannot be overriden by the user but depends on the information in the DataFrame being plotted.
wrap titles:
wrap_title(colored in cyan above)Keyword Prefix
wrap_title_
The text for wrap titles is the column names specified for the
wrapkeyword.
All label elements are styled using the base
Element class attributes for fill color, edge color, and font. The “Lines” category
of base attributes is not used for labels.
The following base attributes of the Element class are not used for this item:
“Lines” category
Legend
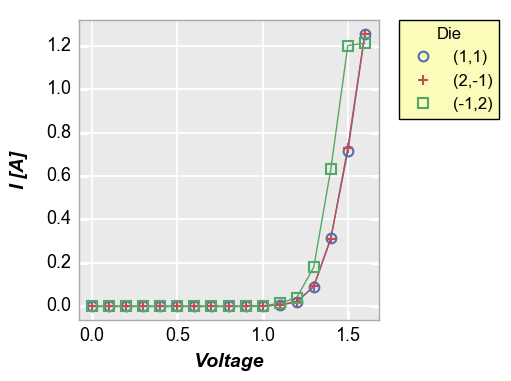
The plot legend (shown in yellow on left) is controlled by keywords with the
prefix legend_. By default, legends are placed outside of the plot area
(where they should be to avoid obscuring data!).
Keyword |
Data Type |
Description |
Default |
Example |
|---|---|---|---|---|
legend |
str |
name of a DataFrame column to use for grouping |
None |
|
location |
int | str |
location of legend (at this time only outside of the plot is available!): |
0 |
None |
|
||||
|
||||
|
||||
|
||||
|
||||
|
||||
|
||||
|
||||
|
||||
|
||||
|
||||
legend_marker_alpha |
float |
alpha of the markers in the legend only |
1 |
|
legend_marker_size |
float |
marker size in legend only |
same as ``marker_size` |
|
legend_points |
int |
number of points for each legend value |
1 |
None |
legend_title |
str |
legend title text |
defaults to legend column name |
None |
The following base attributes of the Element class are not used for this item:
“Lines” category
size
Lines
Lines can be drawn to connect markers on a plot. By default the colors will be selected from the default color list:

The following keywords are related to lines elements:
Keyword |
Data Type |
Description |
Default |
Example |
|---|---|---|---|---|
colors |
hex color str or list of hex color strs |
colors to use for lines and markers |
default list |
|
lines |
boolean |
toggle line visibility |
True |
None |
The following base attributes of the Element class are not used for this item:
“Fill” category
“Edges” category
“Fonts” category
size
text
Markers
Markers are characters that represent the actual data points on a plot. fivecentplots comes with a built-in list of marker styles that are cycled through depending on the number of data sets displayed:

The marker type, size, and color/alpha are all completely customizable via marker_
keywords:
Keyword |
Data Type |
Description |
Default |
Example |
|---|---|---|---|---|
markers |
boolean or list of str characters |
if |
default marker list |
|
if a list of characters, sets the markers to be used (one marker type per curve or data set) |
||||
marker_fill |
boolean |
turn on/off marker fill |
False |
None |
marker_edge_color |
hex color str |
set the marker edge color |
match the line color scheme |
None |
marker_edge_width |
float |
set the marker edge width |
1.5 |
None |
marker_fill_color |
hex color str |
set the marker fill color (only rendered if |
True |
None |
marker_jitter |
boolean |
add a random offset or jitter to the points around their x-value (useful for box plots) |
None |
|
marker_size |
float |
size of the markers (can be specified uniquely from the legend marker size) |
7 |
The following base attributes of the Element class are not used for this item:
“Lines” category
text
Reference Line
A reference line can be drawn on a plot via keywords with the ref_line_ prefix:
Keyword |
Data Type |
Description |
Default |
Example |
|---|---|---|---|---|
color |
hex color str |
color of the reference line |
#000000 |
|
text |
str |
legend text for the reference line |
“Ref Line” |
The following base attributes of the Element class are not used for this item:
“Fill” category
“Edges” category
“Fonts” category
size
Stats
Several options are available for graphically displaying statistical information about a given data set:
Keyword |
Data Type |
Description |
Default |
Example |
|---|---|---|---|---|
conf_int |
float |
Add shading around a curve based on a given confidence interval from 0 to 1 |
None |
` Confidence Intervals <plot.html#Confidence-intervals>`_ |
stat |
str |
Add a line through a data set where each y-value represents a computed statistic of the data at a given x-value. Options include: ‘mean’, ‘median’, ‘std’, ‘q25’ (25% quantile), etc |
None |
|
stat_val |
str |
Column name to use instead of the given ‘x’ column for calculating the stat |
None |
See Stat lines for examples.
Ticks
Tick marks are controlled using keywords beginning with ticks_ and are
referenced to either the major or minor grid:
Keyword |
Data Type |
Description |
Default |
Example |
|---|---|---|---|---|
ticks_<major|minor>_color |
hex color string |
tick color |
#ffffff |
None |
ticks_major_increment |
float |
for major ticks only, the increment between tick marks |
||
ticks_major_length |
float |
the length in pixels of the major tick lines |
6.2 |
None |
ticks_minor_length |
float |
the length in pixels of the minor tick lines |
4.2 |
None |
tick_minor_number |
int |
enable primary y-axis range sharing across all subplots |
True |
|
ticks_major_width |
float |
thickness or edge width of a major tick mark |
2.2 |
None |
ticks_minor_width |
float |
thickness or edge width of a minor tick mark |
1.3 |
None |
To reference a specific axis, add the axis name (x, x2, y, y2, or z) to the keyword
after the designation of the grid (i.e., ticks_major_x_increment or
ticks_minor_y_width. If no axis is specified, the keyword is applied to
all axes.
The following base attributes of the Element class are not used for this item:
“Fill” category
“Edges” category
“Fonts” category
size
text
Tick Labels
Tick labels or the text associated with a tick mark have the same attritubes
as any other text label. Keywords begin with tick_labels_ followed by the
major or minor grid and an option specification of the axis of interest. For example:
tick_labels_major_font_sizetick_labels_minor_x_rotation
See Labels for more details.
The following base attributes of the Element class are not used for this item:
“Lines” category
text
Title
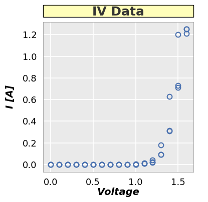
The title element (shown on right in yellow) adds a title centered above the top of the plot(s).
The title text is added directly via the title keyword:
title = 'IV Data'
title elements are styled using the base
Element class attributes for fill color, edge color, and font. The “Lines” category
of base attributes is not used for titles.
The following base attributes of the Element class are not used for this item:
“Lines” category
Whitespace
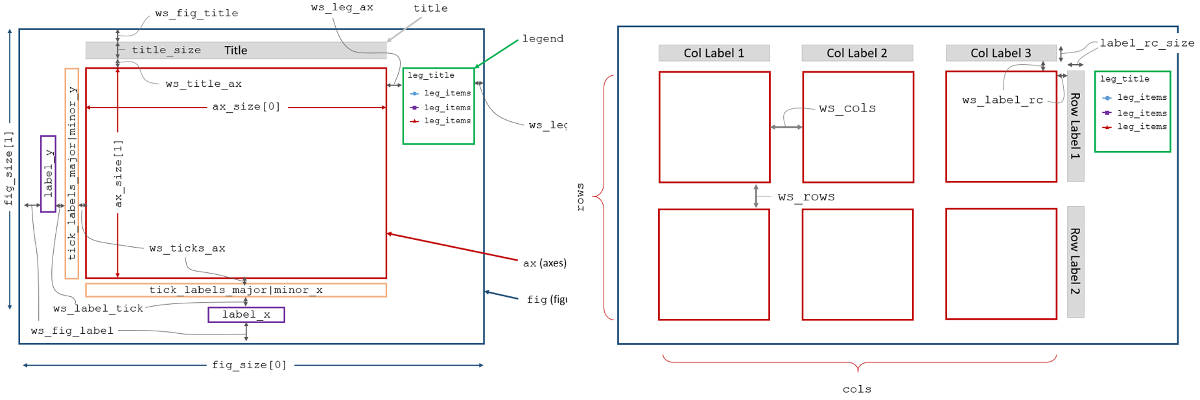
Whitespace keywords are prefixed by ws_ and are followed by the two items
that sandwich the whitespace, going from left to right or top to bottom:
Category |
Keyword |
Data Type |
Description |
Default |
|---|---|---|---|---|
Row/column grid |
ws_label_col |
int |
col label to top edge of axes window |
10 |
ws_label_row |
row label to right edge of axes window |
10 |
||
ws_col |
space between columns |
30 |
||
ws_row |
space between rows |
30 |
||
Figure |
ws_fig_label |
left figure edge to ``label_y` |
10 |
|
ws_leg_fig |
right legend edge to right figure edge |
10 |
||
ws_fig_ax |
top figure edge to top edge of axes with figure title disabled |
20 |
||
ws_fig_title |
top figure edge to top of figure title |
10 |
||
Axes |
ws_label_tick |
space between axis label and tick labels |
10 |
|
ws_leg_ax |
right edge of axes to left edge of legend box |
20 |
||
ws_ticks_ax |
space between tick labels and axes |
5 |
||
ws_title_ax |
bottom edge of title to top edge of axes window |
10 |
||
ws_ax_fig |
right edge of axes to right edge of figure with legend disabled |
30 |
||
Ticks |
ws_tick_tick_minimum |
minimum space between consecutive ticks |
10 |
|
Boxplot |
ws_ax_box_title |
right edge of axes to right edge of box title text |
10 |
Data
Some parameters of the plot are handled by the Data class in fivecentplots. This
class is responsible for defining the unique groups for each plot, handling subplots,
etc. These keywords are added to the plot function call just like element attribute
keywords.
Keyword |
Data Type |
Description |
Default |
Example |
|---|---|---|---|---|
auto_scale |
True |
enable/disable auto-scaling feature for one-side range |
True |
|
specification; not allowed for heatmap or histogram |
||||
col |
str |
name of DataFrame column to use for column-based subplots |
None |
|
fig_groups |
str|list of str |
DataFrame column(s) to use for figure-level grouping |
None |
|
filter |
str |
string-based DataFrame filter (similar to query in pandas) |
None |
see most plot examples |
ncol |
int |
specify the number of columns in a wrap plot |
try to make square grid |
|
row |
str |
name of DataFrame column to use for row-based subplots |
None |
|
share_x |
boolean |
enable primary x-axis range sharing across all subplots |
True |
|
share_y |
boolean |
enable primary y-axis range sharing across all subplots |
True |
|
share_z |
boolean |
enable primary z-axis range sharing across all subplots |
True |
|
share_x2 |
boolean |
enable secondary x-axis range sharing across all subplots |
True |
|
share_y2 |
boolean |
enable secondary y-axis range sharing across all subplots |
True |
|
share_col |
boolean |
enable axis range sharing for all subplots in a column of subplots |
False |
|
share_row |
boolean |
enable axis range sharing for all subplots in a row of subplots |
False |
|
trans_x |
str|None |
apply an axis transformation to a given axis |
None |
None |
options: ‘abs’, ‘negative’ or ‘neg’, ‘nq’ (normal quantile) |
||||
inverse’ or ‘inv’, (‘pow’, int), ‘flip’ |
||||
trans_x2 |
str|None |
same as |
None |
None |
trans_y |
str|None |
same as |
None |
None |
trans_y2 |
str|None |
same as |
None |
None |
trans_z |
str|None |
same as |
None |
None |
wrap |
str|list |
name or list of names of DataFrame columns for wrap-type subplots |
Other
Keyword |
Data Type |
Description |
Default |
|---|---|---|---|
filename |
str |
Name of the saved plot |
Built automatically based on plot conditions |
filepath |
str |
Directory in which the plot should be saved |
Current directory |
inline |
boolean |
Display the plot inline (in a jupyter notebook, using the matplotlib show command, etc) |
True |
print_filename |
boolean |
Print the filename and return the plot |
False |
return_filename |
boolean |
Return only the filename of the saved plot but not the plot itself |
False |
save |
boolean |
Save the image |
True |
save_ext |
str |
File extension for the saved plot |
png |
show |
boolean |
Open the saved plot (this is not the same as show in matplotlib) |
False |