contour
This section provides examples of how to use the contour function. At a
minimum, the plot function requires the following keywords:
df: a pandas DataFramex: the name of the DataFrame column containing the x-axis datay: the name of the DataFrame column containing the y-axis dataz: the name of the DataFrame column containing the z-axis data
Setup
Imports
In [1]:
%load_ext autoreload
%autoreload 2
%matplotlib inline
import fivecentplots as fcp
import pandas as pd
import numpy as np
import os, sys, pdb
osjoin = os.path.join
db = pdb.set_trace
Sample data
In [2]:
df = pd.read_csv(osjoin(os.path.dirname(fcp.__file__), 'tests', 'fake_data_contour.csv'))
df.head()
Out[2]:
| Experiment | Batch | X | Y | Value | |
|---|---|---|---|---|---|
| 0 | Control | 101 | 1 | -4 | 3.5 |
| 1 | Control | 101 | 1 | -2 | 2.1 |
| 2 | Control | 101 | 1 | 0 | 3.3 |
| 3 | Control | 101 | 1 | 2 | 3.2 |
| 4 | Control | 101 | 1 | 4 | 4.0 |
Set theme
In [3]:
#fcp.set_theme('gray')
#fcp.set_theme('white')
Other
In [4]:
SHOW = False
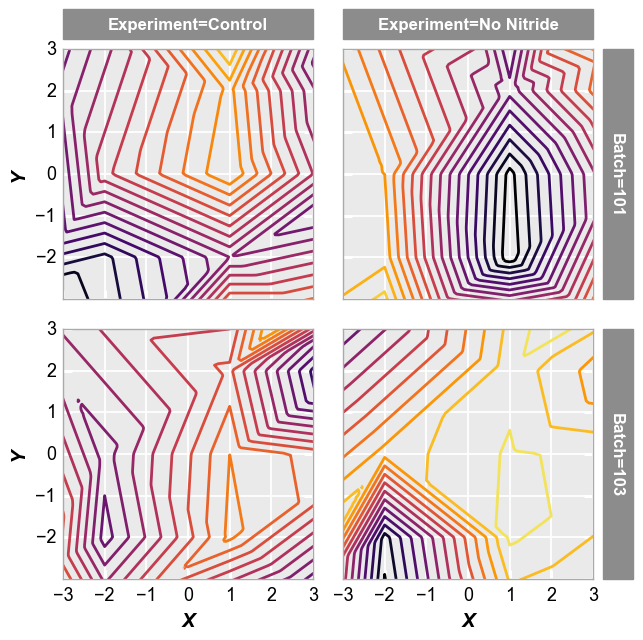
Basic contour
In [5]:
fcp.contour(df=df, x='X', y='Y', z='Value', row='Batch', col='Experiment', filled=False,
            cbar=False, xmin=-3, xmax=3, ymin=-3, ymax=3, ax_size=[250,250], show=SHOW, contour_width=2,
            label_rc_font_size=12)
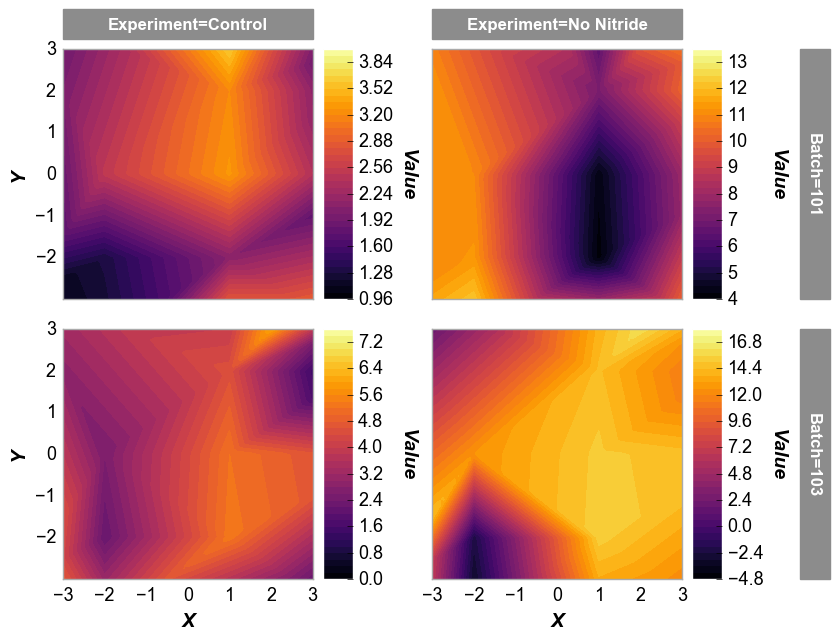
Filled contour
Next we can fill the contours using the keyword filled or
contour_filled and increase the number of contour lines from the
default of 20 to a custom value using the keyword levels or
contour_levels:
In [6]:
fcp.contour(df=df, x='X', y='Y', z='Value', row='Batch', col='Experiment', filled=True,
            cbar=True, xmin=-3, xmax=3, ymin=-3, ymax=3, ax_size=[250,250], show=SHOW,
            label_rc_font_size=12, levels=40)
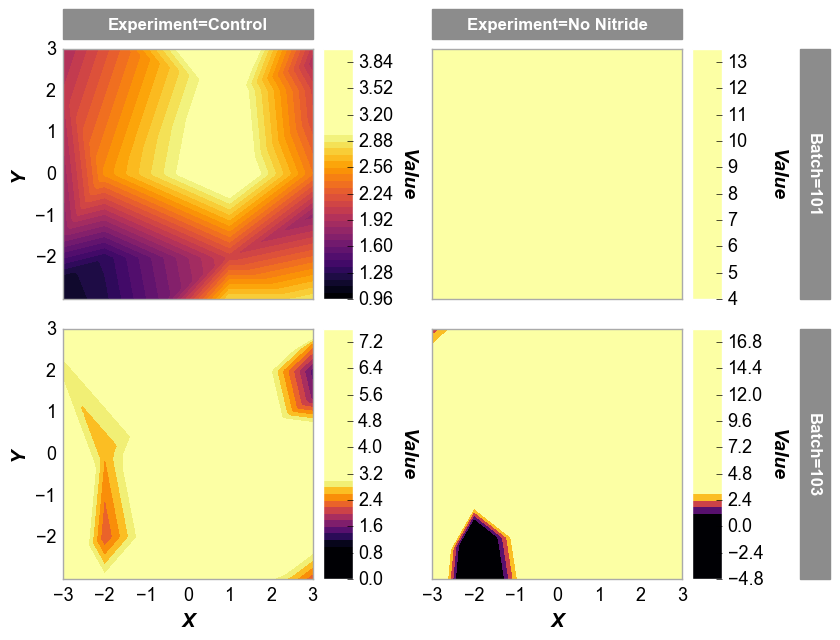
And with a fixed z-range:
In [7]:
fcp.contour(df=df, x='X', y='Y', z='Value', row='Batch', col='Experiment', filled=True,
            cbar=True, xmin=-3, xmax=3, ymin=-3, ymax=3, ax_size=[250,250], show=SHOW,
            label_rc_font_size=12, zmin=1, zmax=3, levels=40)