lines
- fcp.lines()
Dummy function to return the lines API with help() (not used directly for plotting).
- Keyword Arguments
cmap (str) – Color map name (overrides all other color parameters). Defaults to None. More details
line_alpha (str|list) – Transparency value for the line(s) between 0-1. Defaults to 1. More details
line_color (str|list) – Hex color string or list of hex color strings for the plot lines. Defaults to fcp.DEFAULT_COLORS. More details
line_style (str|list) – Matplotlib string character for line style {‘-‘; ‘–’; ‘-.’ ‘:’}. Defaults to ‘-‘. More details
line_width (int|list) – Line width in pixels. Defaults to 1. More details
lines (boolean) – Enable/disable plotting of lines. Defaults to True. More details
Examples
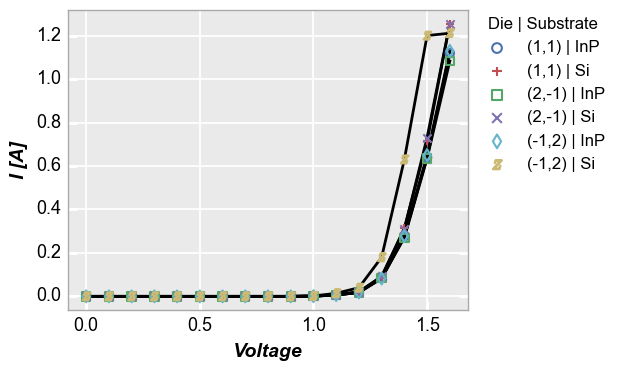
All lines the same color:
>>> import fivecentplots as fcp
>>> from pathlib import Path
>>> import pandas as pd
>>> df = pd.read_csv(Path(fcp.__file__).parent / 'test_data' / 'fake_data.csv')
>>> fcp.plot(df, x='Voltage', y='I [A]', legend=['Die', 'Substrate'], ax_size=[400, 300],
             filter='Target Wavelength==450 & Temperature [C]==25 & Boost Level==0.2',
             line_color='#000000', line_width=2)
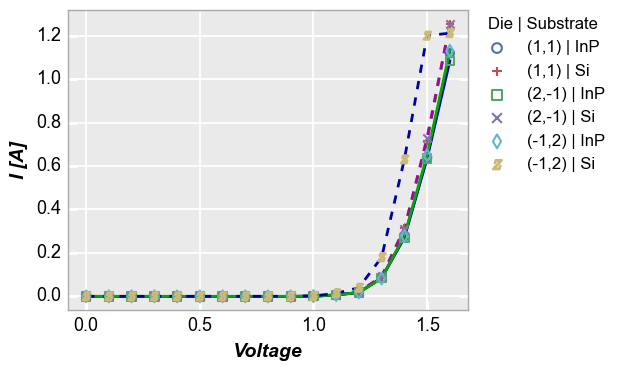
Patterns of alternating custom color and style:
>>> import fivecentplots as fcp
>>> from pathlib import Path
>>> import pandas as pd
>>> df = pd.read_csv(Path(fcp.__file__).parent / 'test_data' / 'fake_data.csv')
>>> fcp.plot(df, x='Voltage', y='I [A]', legend=['Die', 'Substrate'], ax_size=[400, 300],
             filter='Target Wavelength==450 & Temperature [C]==25 & Boost Level==0.2',
             line_color=['#AA00AA', '#00AA00', '#0000AA'],  line_width=2, line_style=['-', '--'])
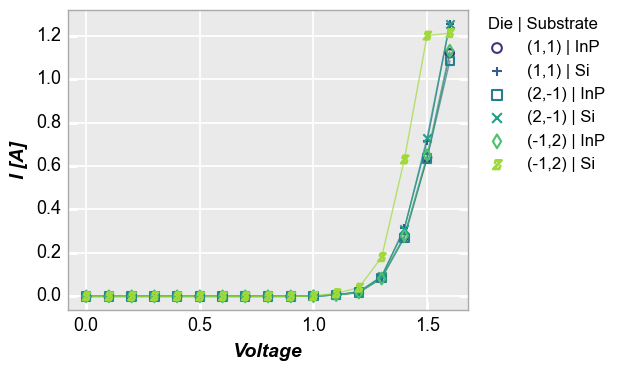
Use a colormap with alpha:
>>> import fivecentplots as fcp
>>> from pathlib import Path
>>> import pandas as pd
>>> df = pd.read_csv(Path(fcp.__file__).parent / 'test_data' / 'fake_data.csv')
>>> fcp.plot(df, x='Voltage', y='I [A]', legend=['Die', 'Substrate'], ax_size=[400, 300],
             filter='Target Wavelength==450 & Temperature [C]==25 & Boost Level==0.2',
             cmap='viridis', lines_alpha=0.7)
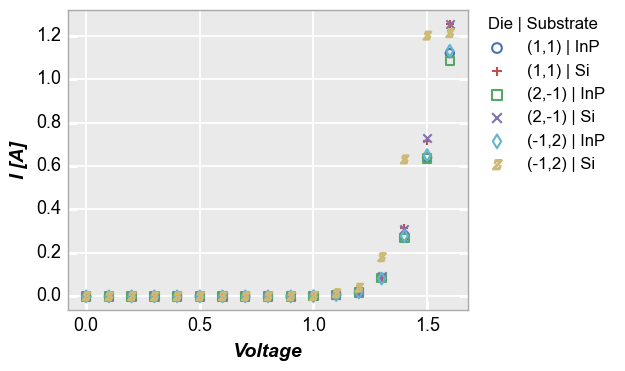
No lines:
>>> import fivecentplots as fcp
>>> from pathlib import Path
>>> import pandas as pd
>>> df = pd.read_csv(Path(fcp.__file__).parent / 'test_data' / 'fake_data.csv')
>>> fcp.plot(df, x='Voltage', y='I [A]', legend=['Die', 'Substrate'], ax_size=[400, 300],
             filter='Target Wavelength==450 & Temperature [C]==25 & Boost Level==0.2',
             lines=False)