gantt
- fcp.gantt(**kwargs)
- Gantt chart plotting function. This plot is built off of a horizontal
implementation of fcp.bar.
- Parameters
df (DataFrame) – DataFrame containing data to plot
- Keyword Arguments
x (list) – two x-axis column names containing Datetime values [REQUIRED] - 1) the start time for each item in the Gantt chart - 2) the stop time for each item in the Gantt chart
y (str) – y-axis column name [REQUIRED]
gantt_color_by_bar|color_by_bar (bool) – Color each Gantt bar differently. Defaults to False. More details
gantt_edge_color (str) – Hex color string for the edge of the Gantt bars.
Defaults to fcp.DEFAULT_COLORS . More detailsgantt_edge_width (float) – Width of the edge of the Gantt bars in pixels. Defaults to 0. More details
gantt_fill_alpha (int) – Transparency value for the Gantt bars between 0-1. Defaults to 0.75. More details
gantt_fill_color (str) – Hex color string of the Gantt bar fill .
Defaults to fcp.DEFAULT_COLORS .gantt_height|height (float) – Set the fractional height of the Gantt bars between 0-1. Defaults to 0.9. More details
gantt_label_x (str) – By default, x-axis labels are disabled for this plot type. Defaults to ‘’.
legend (gantt_order_by_legend|order by) – Order the y-axis values based on the sort order of the legend values [requires legend]. Defaults to False. More details
gantt_tick_labels_x_rotation|tick_labels_x_rotation (int) – Gantt-specific version of the this kwarg to ensure rotations are not applied globably to all plots from a theme file. Defaults to 90. More details
sort (str) – Sort order for the Gantt bars {‘ascending’, ‘descending’}. Defaults to ‘descending’. More details
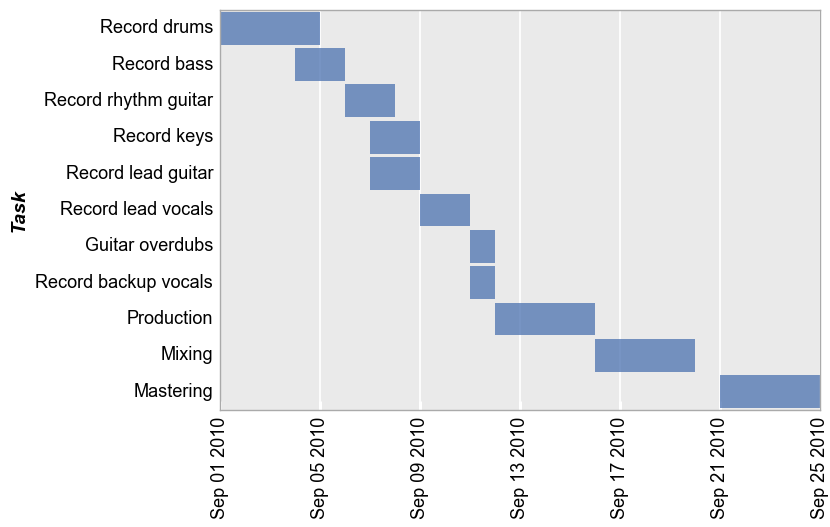
Examples
>>> import fivecentplots as fcp
>>> from pathlib import Path
>>> import pandas as pd
>>> df = pd.read_csv(Path(fcp.__file__).parent / 'test_data/fake_data_gantt.csv')
>>> fcp.gantt(df, x=['Start', 'Stop'], y='Task', ax_size=[600, 400])