Report Structure
General Report Structure
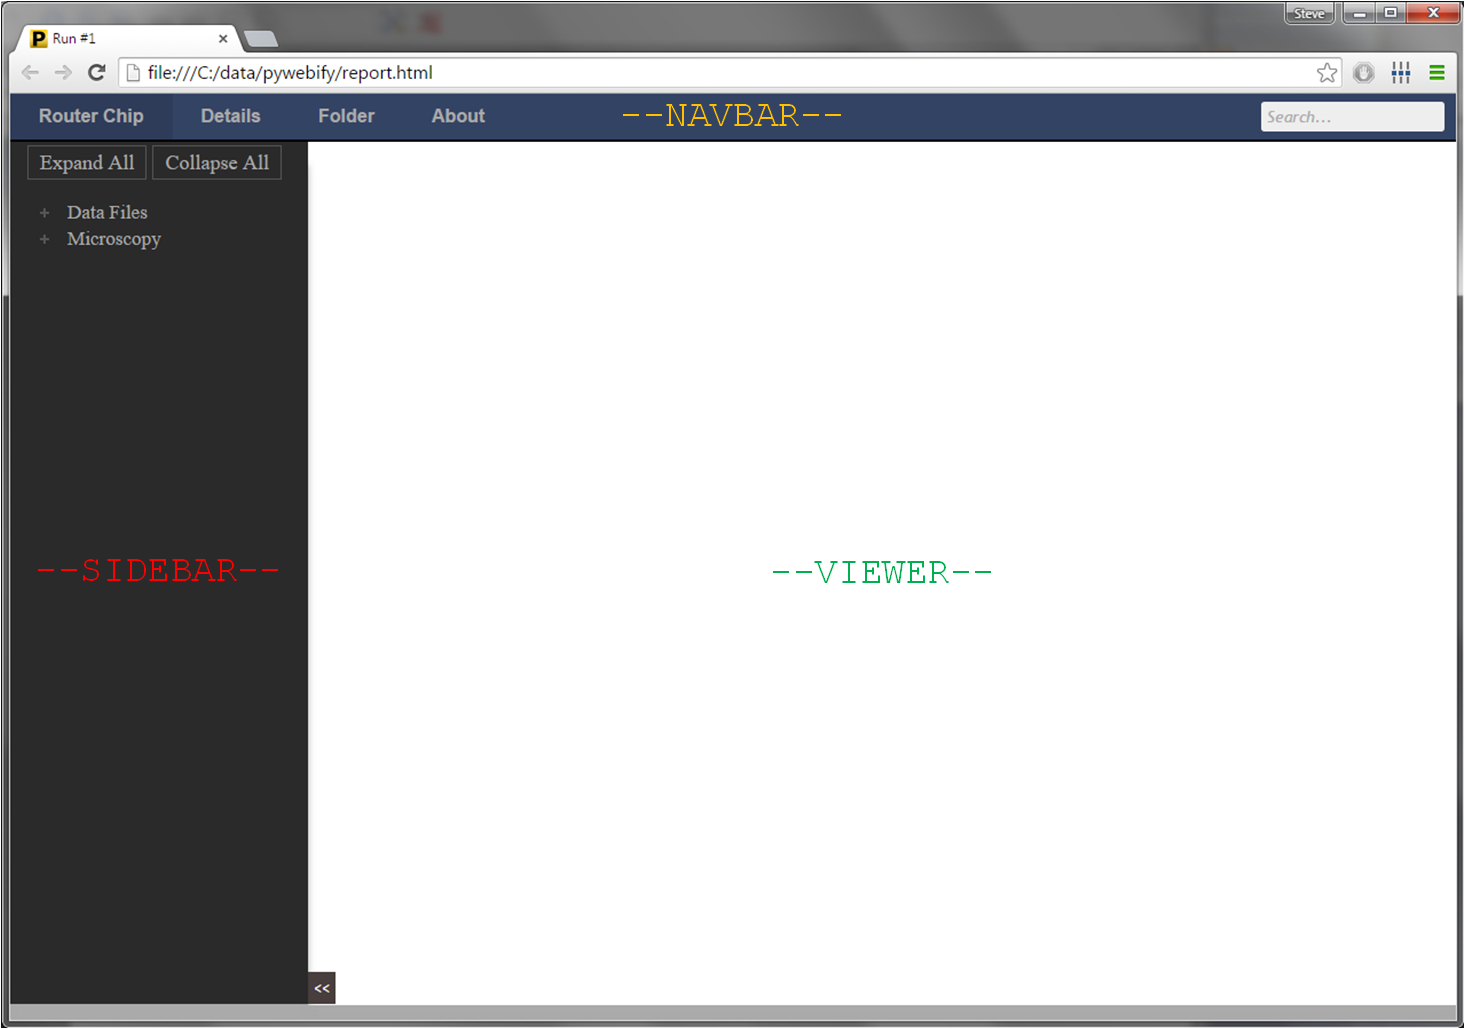
A PyWebify report typically consists of three key sections:
- a navigation menu bar or navbar that can be used to provide report titles and links to relevant imformation (experiment details, previous reports, DOE split tables, etc.)
- a sidebar that consists of searchable links to image or html files
- a viewer section that displays the images or html files when hovering on the sidebar links
A sample report is shown below:
Report Contents
PyWebify reports can consist of content aggregated in two distinct ways:
- from a entire discrete directory tree
- from a custom list of files and/or folders
PyWebify supports viewing of any image files (jpg, png, tiff, etc.) or html files within the viewer section. The ability to include html files allows the user to include some dynamic content like interactive html tables or bokeh plots. The specific types of files to be included in the sidebar directory can be directly controlled by the user.
Customization
PyWebify is template based so the options of how to present the data and how to style the report are unbounded. Many options (color, spacing, etc.) can be specfied by adjusting CSS parameters in the config file.
Features
Resizing images
Image files and plots can be zoomed in or out using the following commands:
- Zoom in: Ctrl + click on displayed image
- Zoom out: Shift + click on displayed image
- Resize to native image size: Alt + click on displayed image
Adding HTML to a displayed image
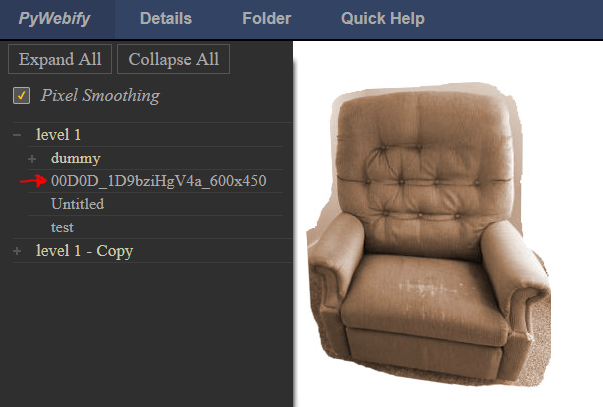
PyWebify allows you to append more details, summary tables, conclusions, etc. to a given image via HTML. If PyWebify finds an html file with the exact same file path as an image but with the file extension `.html`, it will automatically append the html (including any accompanying css or javascript) to the image. In this mode, the image itself can still be resized as described above.
For example, with the image only (image filename: “00D0D_1D9bziHgV4a_600x450.jpg”):
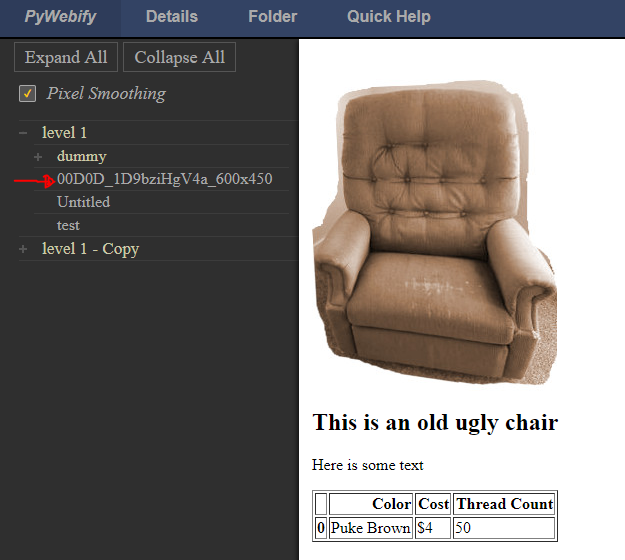
Now we can add the following html file (filename: “00D0D_1D9bziHgV4a_600x450.**html**”):
<h2>This is an old ugly chair</h2>

<p>Here is some text</p>

<table border="1" class="dataframe">
    <thead>
        <tr style="text-align: right;">
            <th></th>
            <th>Color</th>
            <th>Cost</th>
            <th>Thread Count</th>
        </tr>
    </thead>
    <tbody>
        <tr>
            <th>0</th>
            <td>Puke Brown</td>
            <td>$4</td>
            <td>50</td>
        </tr>
    </tbody>
</table>
which renders in the PyWebify report as:
Note
Merging of image and html with the same name can be disabled by setting the
keyword merge_html to False when building the report
Direct links to content
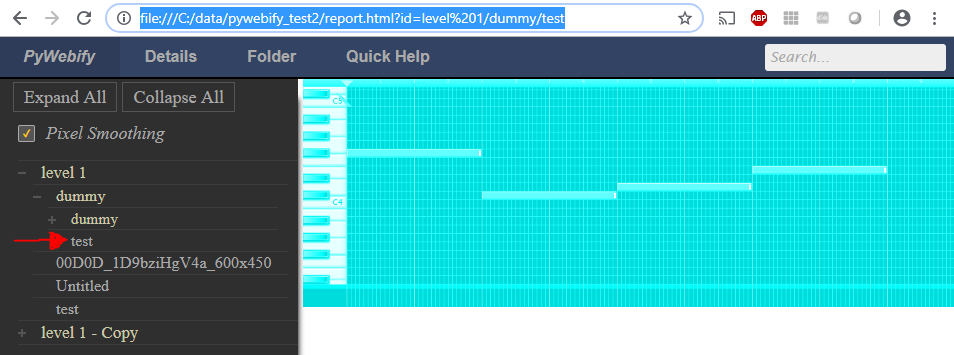
There are multiple instances where you may want to link directly to an image that
is nested within the folder structure. PyWebify allows this by adding ?id=PATH,
to the end of the URL, where PATH is the relative path to the image. For example:
file:///C:/data/pywebify_test2/report.html?id=level%201/dummy/test
will open the report already navigated to the desired image:
You can get the url of any image link by right-clicking on the link in the sidebar and selecting the option to copy the hyperlink.